Trending Assets
Top investors this month
Trending Assets
Top investors this month
@mapsignals
MAPsignals
$4.1M follower assets
MAPsignals is a data platform that tracks unusual trading volumes in stocks and ETFs, revealing institutional money flows. Sign up for free insights here: www.MAPsignals.com/free-signup YouTube: https://www.youtube.com/@MAPsignals
36 following708 followers
MACRO: Six Big Reasons to Buy Small-Cap Stocks
One of the least loved areas of the market is getting an upgrade today.
Battered small-caps have not kept pace with large-caps all year. But we see that dynamic shifting.
There are six big reasons to buy small-cap stocks over the near-to-medium term.

As a reminder, last August we told you to buy small-cap stocks. Our analysis pointed to an 8% 12-month price gain, plus dividends.

Since then, small-cap equities are up about 12%. Not bad. But the S&P 500 is up roughly 25%.

Smaller stocks have historically delivered higher returns than the S&P 500. Lately, not so much.

Today, we’re going to dive into the macro picture, which signals explosive gains could be on the horizon.

If that’s not enough, as a bonus we’ll even showcase a top-rated stock beaming with Big Money support.

It’s time to go big by going small!


To kick things off, let’s rewind the tape to March. Back then we told you Federal Reserve rate cuts might be delayed but they wouldn’t be denied in 7 Charts Signal More Pain for the Bears.

Sure enough, recent dovish economic data has Fed easing back on the table. Futures markets expect the first rate cut in September.

Treasury yields are pulling back after a big year-to-date run-up.

Lower rates are great for small-cap stocks because they stimulate economic growth. Small companies are more leveraged to the health of the economy than larger firms. Small companies also carry more debt than blue chips and pay higher interest rates on those loans.

Add it all up and the first reason number to like small-cap stocks is for their love of falling interest rates.

There’s a clear negative correlation between the 10-year Treasury yield and small-cap stock performance. When one zigs, the other zags.

Falling rates mean it’s finally time to bet big on small-cap stocks. Notice how when the black line (10-year yields) falls, the S&P Small Cap 600 (blue line) surges:

Let’s keep this bullish thesis going and talk about valuations.

Small-cap stocks have rarely been cheaper relative to the S&P 500. Since 1995, they’ve averaged a 3% valuation premium because they’ve delivered slightly higher long-term returns.

Right now, at 14.9x 12-month forward earnings per share, small-cap stocks are trading at a 27% discount to the S&P 500’s forward price-earnings ratio of 20.3x.

A historically low relative valuation is reason number two to start overweighting smaller companies:

Can it get better? YES!

The S&P SmallCap 600 index is currently trading in its cheapest historical valuation quartile. The following chart should rattle some bears.

Since 1990, small-cap stocks have posted a 23% average 12-month gain when starting from the cheapest quartile.

A rock-bottom absolute valuation is a solid third reason to own small-cap equities:

The best tactical news we can share is that market participation has been broadening. We made mention of this back in January when we told you Macro Drivers Signal a Broadening Rally in 2024.
Technology isn’t the only game in town anymore. Cyclical sectors like energy, industrials, and financials are all up big this year.

The fourth reason small-cap stocks should be on your radar is due to our sector rankings. Since March, our favorite areas have been none other than energy, financials, and industrials, echoing our bullish small-cap tilt:

And for our readers that like playing the index theme, here’s the best part: small-cap indices like the Russell 2000 and the S&P SmallCap 600 are loaded with cyclical stocks.

The number five reason to like small equities is due to their heavier weight in these cyclical areas.

Financials and industrials combined are nearly 50% of the allocation in the S&P SmallCap 600 compared to less than 25% of the S&P 500.

Check it out:

With the economy continuing to hum, inflation falling, and Fed easing around the corner, greater cyclical exposure means it’s finally time to bet big on small-cap stocks.

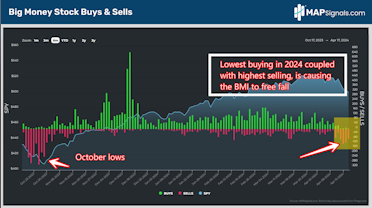
And the Big Money has been doing that in spades over the last three months.

The number six reason to buy smaller stocks is money flows favoring them recently. A staggering 83% of our 4,877 discrete equity inflows have been in companies with market caps below $50 billion:

Add it all up and the macro and money flow backdrop favors previously unloved small-caps. That’s a powerful 1-2 punch!

And to give you an idea of what the rewards of focusing on top-ranked stocks under heavy accumulation look like, check out a recurring theme in our data since last August.

Energy firm Tidewater, Inc. ($TDW) has been one of the most bought names in the past year. Each of these blue signals are the times the stock landed on our Top 20 list.
Rarely do stocks have a money flow picture this strong:

And I should mention our consistent bet on Super Micro Computer, Inc. ($SMCI) beginning in the summer of 2022 – in the teeth of the bear market.

Bet on small-caps, but also focus on the best of breed stocks loved by institutions.


Goldilocks growth and falling inflation mean the Fed will begin easing later this year. Treasury yields are pulling back after a big run-up. Falling rates mean it’s finally time to bet big on small stocks.

And don’t forget that since 1990, small-cap stocks have posted a 23% average 12-month gain when starting from the cheapest quartile.

Throw in Big Money buying and a bigger allocation to the resurgent energy, financials, and industrials sectors, and you’ve got a recipe for success.

Add it all up and small stocks offer a great risk/reward profile.

Use a map to spot the outliers!

If you want to identify specific small-cap stocks ramping with Big Money support, get started with a MAPsignals PRO subscription. It’ll get you access to our portal that updates every morning, showcasing the stocks getting bought and their scores.

It’s time to go big by betting small with MAPsignals!

Invest well,
-Alec Young
post mediapost mediapost mediapost media
portal.mapsignals.com
MAPsignals Portal

Nvidia’s Growth Rate Easily Justifies its High Multiple, Alec Young
"That kind of growth easily justifies a 30-type multiple for a blue chip stock."
Alec Young, Chief Investment Strategist at @mapsignals, discusses Nvidia’s $NVDA growth rate and valuation with @cnbc.

CNBC
Nvidia's growth rate easily justifies its high multiple, says Alec Young
Alec Young, Chief Investment Strategist at MAPsignals, discusses Nvidia's growth rate and valuation.

3 Reasons We’re Gearing Up for a Summertime Rally
Markets have been quiet lately, effectively trading flat the last 2 months.
Investors are looking for the next catalyst to lift equities higher.
We’ve got you covered as we see a very positive forward picture unfolding.
Today we’ll share 3 reasons we’re gearing up for a summertime rally.

Coming into 2024, our stance was simple: We expected big gains for stocks. Between depressed investor participation, re-accelerating earnings growth, and narrow market leadership – the data pointed to strong upside.

Our message has not changed. The bull market is not over.

And while stocks have stammered lately, we view this as temporary and healthy after the S&P 500 staged an awe-inspiring 28% rip from the market lows in October.

Today we are going to dive into our data and look at some hard-hitting evidence pointing to better days ahead.

Whether you’re a market technician or macro enthusiast, the backdrop for stocks is overwhelmingly constructive.


Let’s take the temperature of the market. The supply and demand picture has shown plenty of weakness the last few months.

The Big Money Index (BMI), a real-time gauge of institutional positioning, has been declining from a red-hot overbought reading (80%+) to the low 40s as of late.

This downtrend reveals how the rally in markets has not been broad-based. Anytime the BMI is under pressure, it signals that more individual stocks are being sold compared to those under accumulation:

One look at this chart could have you second guessing buying equities. Afterall, who wants to call the BMI low?

Turns out, magnitude matters. A free-falling BMI tends to signal near-term chop before a mega pop.

Reason number 1 to prepare for a summertime rally is due to the study from last week. If you recall, we went back in our data and reviewed all instances when the BMI dropped 40+ points in a 4-month time period.

What it foretells is that we are edging closer to a powerful rally. When you study all 303 instances, the S&P 500 averages a 2.2% lift a month later, a 5% rip 3-months out, and a market-beating 14.8% gain 12-months later.

It’s important to note that anytime the BMI 40+ points from a red-hot overbought period like now, it’s ultra rare. Those handful of instances resulted in near-term weakness before a huge pop months later.

In either case, now is the time to be picking spots on high-quality stocks under pressure:

That is a lot of green…anyone who’s been following us knows that when the BMI starts to trend higher, stocks bounce hard and fast.

It’s not a matter of if, but when.

But we can’t stop here. History proves that we are weeks away from a positive technical catalyst.
Reason number 2 to prepare for a summertime rally is due to a very powerful seasonal tailwind beginning in late May.

The old Wall Street adage to sell in May should be revised to include but remember to buy in the summer months.

While I can’t deny that stocks sputter in late April through early May since 1998, this chop fest bleeds into a humongous multi-month rally.

Below shows this beautifully. Since 1998, May 20th – July kicks off a powerful market thrust. The S&P 500 gains an average of 1.74% in this multi-month period.

Even more promising is the +2.52% rip in the S&P Small Cap 600… this is important given the lagging performance for the group in 2024:

This point on small-caps is a focus for us at MAPsignals. Rising interest rates have been the noose around their neck ever since the Fed began lifting interest rates to battle out-of-control inflation.

Higher interest rates penalize smaller less capitalized firms more given higher debt levels. But that headwind is soon to unwind as we get closer to the next policy move from the Fed: interest rate cuts.

It’s not a matter of if the Fed is going to cut rates, it’s when.

Reason number 3 we’re preparing for a summertime rally is due to the fact that small-caps in particular soar when the Fed cuts interest rates and the economy dodges a recession.

We’ve noted the broadening out of the market since March. Prior unloved areas like Energy, Financials, and Industrials began to see a massive rotation of inflows at the expense of overweight Technology positioning.

I believe this rising tide under the surface of the market is due to savvy investors positioning ahead of a coming rate cut in 2024.

Probabilities for the first rate cut is now pegged at September. If this holds true, you can bet that institutions will be positioned well ahead of it.

And history shines a mega bright green light on small caps once the first Fed rate cut hits and there’s no recession.

Since mid-1995, when the Fed makes the first interest rate cut and the economy is not in recession and doesn’t fall into a recession a year later:

  • Small caps rip 4.8% a month later
  • They vault 10.6% 3-months after
  • And they soar 19.3% 12-months later

Ladies and gentlemen, the stage is set for better days ahead.

The free-falling BMI is a time to grab high-quality companies on sale. Marry this with a very intense seasonal tailwind beginning in a couple of weeks…and the setup makes a ton of tactical sense.

Should the macro data also strengthen the case for a rate cut this year, you’re looking at an extremely favorable situation for stocks…especially down-and-out small caps.

Use the drop to position for the pop.

Let’s wrap up.

Here’s the bottom line: Our cautious stance the last couple of months is drawing to a close. Our market North Star, the BMI, is telling us to prepare for healthier participation from institutional investors.

Not only that, tis the season to prepare for a strong equity tailwind. Late May kicks off a powerful 2-month rally for both small and large caps.

Round it all out with possibly the biggest macro tailwind around the corner, the start of interest rate cuts, and you’re looking at a powerful summertime rally cocktail.

Don’t miss the boat.

Use a map to navigate your portfolio now.

Don’t wait for the media to get bullish…by then it’ll be too late.

The next leg higher is approaching.

If you’re a serious investor, money manager, or Registered Investment Advisor (RIA), looking to take your research to the next level, now’s a wonderful time to see the power of money flows on individual stocks.

post mediapost mediapost mediapost media
MAPsignals
Solutions - MAPsignals
MAPsignals’ volume and price analysis tools enable investors to identify unusually large trading activities around individual stocks and ETFs. This allows traders and investors to move beyond sentiment with a more precise, predictive, and measured data analysis tool that MAPs the signals being delivered by the market’s biggest players.MAPsignals capabilities include: Read more »

Today’s ‘Pain Trade’ is Catching Many Investors Off-Guard | CNBC
“You’re not going to get some huge selloff to get back into the markets,” Alec Young, our chief investment strategist, said in an interview with Bob Pisani of @cnbc.
“The Fed always says we are data dependent,” he added. “If we get more data that is inflation friendly, we are going to be at new highs fast.”

CNBC
Today's 'pain trade' is a rapidly rising market catching many investors off-guard
'If we get more data that is inflation friendly, we are going to be at new highs fast,' one strategist says.

Major Ultra-Bullish Signal is Approaching
Plenty of growth stocks are feeling the pain.
That’s what happens when institutional demand grinds to a halt.
Don’t fret. One rare setup just fired, indicating a major ultra-bullish signal is approaching.

The rips and dips keep coming for equities. The Fed presser from yesterday offered little confidence for investors. We’ll let other research shops recap that narrative.

At MAPsignals, we’re going to focus on what we do best: Money Flows.

Our market North Star, the Big Money Index (BMI), has been in free-fall for weeks…even dropping further after yesterday’s intraday pump and slump.

But there’s good news. A monster bullish setup is forming in our data. If history is any guide, we are looking at a crowd-stunning rally coming later this year.

Now is not the time to get fearful. It’s time to get cheerful.


The all-clear signal is not here yet.

That’s evidenced by the Big Money Index sinking day after day.

As highlighted last week, seasonal volatility is causing overall weakness and rotational action. Inflows are seen in more cyclical areas like Energy, Financials, and Industrials as money is fleeing Big Tech.

Given Tech’s huge market weight in the S&P 500, those outflows are why major large-cap indices are anchored.

Below shows how the BMI continues to spiral, last hitting a YTD low of 47.2%:

And while I’ve been pointing to overall weakness in our data since February, today’s data-driven environment is actually quite rare.

Our BMI has been trending lower since December 29th. That’s a long period… one that suggests a major ultra-bullish signal is approaching.


Last week we took a deep dive in our data and found something interesting. When the BMI falls 40+ points in 16 weeks, it’s extraordinary.

In fact, over the past 30 years, it’s occurred 303 times.

While that may not seem exceptional on the surface, in reality most of those instances cluster around 17 discrete episodes throughout the 3 decade period including back-tested data.

But history proves these prolonged money flow dips are quite bullish over the medium to long-term. Even more striking are periods that are very similar to today’s environment.

I’m referring to conditions when the BMI fell 40+ points from a red-hot overbought reading over the next 4-month trading period.

Let’s visualize one from recent memory.

We experienced a similar peak to drop like now after the pandemic. From mid to late 2020, the BMI dropped from the 90 area to the low 50s, eerily similar to today.

By far this is the closest analog to today’s situation:

  • Investors were still spooked by the unprecedented macro environment
  • Bearish rhetoric was all over the media given the unfolding pandemic

That pullback eventually ended with a powerful rally starting soon later:

What’s important to note is that market lows were eventually hit and the BMI began rallying well ahead of the surge that followed.

Turns out, this similar pattern has been rather predictable in our data.

If you’re allergic to an extremely bullish setup, LOOK AWAY NOW.

When we single out similar BMI pullbacks to now, we find 6 instances ranging from 1998, 2019, & 2020.

What we find is near-term stocks struggle with the S&P 500 falling 4.1% a month later and 1.2% 3-months later.

But the underlying message that you need to heed is stocks zoom 6 and 12 months later with average gains of 14% and 20.3% respectively.

If that doesn’t impress you, I’ve included all 303 instances as well. In aggregate, they forecast market beating forward returns:

But I don’t want to stop with the coming bullish message.

For those that think Technology stocks are not going to shine again…keep dreaming.

This massive BMI drop favors those bold enough to bet on high-quality growth stocks.

Here I’ve performed the same analysis but with the NASDAQ 100 ($NDX). The same weakness is seen 1 to 3 months out, with -2.5% and -.2% returns respectively.

But that’s when you want to be accumulating best of breed stocks. 6-months later the $NDX surges 31.6% and 12-months later an awe-inspiring 49.5% jolt is seen.

And for those curious, the 303 instances offer outstanding forward gains too:

Folks, stop worrying about interest rates. You might risk missing a major ultra-bullish situation.
Instead, follow evidence-based data.

New market leaders are under heavy accumulation…now isn’t the time to bounce, it’s the time to pounce.

We are getting our subscribers ready for when the all-clear signal finally strikes. I firmly believe it’s around the corner.

Just like we sent out some of the best stocks to buy in October, we’re prepping for a similar rip.
A market map is the way.

Here’s the bottom line: Investors are looking for clarity in this turbulent market. Data has more answers than the news ever will.

We are currently witnessing a rare 40+ point drop in the Big Money Index (BMI). History says a little more pain will lead to monster gains in the coming months.

Not only that, whenever the BMI drops 40+ points from a red-hot overbought period similar to now, stocks have never been lower a year later, with the NASDAQ averaging a 49.5% twelve-month gain.

Don’t stop and stare. PREPARE!

After doing this study, earlier this week we sent 3 stocks to our PRO Members that we love for this coming uptrend. And chances are they aren’t names you’re familiar with…but the Big Money loves them!

Listen, a major ultra-bullish signal is approaching.

Don’t wait for the media bull whistle to blow…it’ll be too late.

Follow the money and you’ll be ahead of the move.

Have a great week!

If you’re a money manager, investment advisor, or someone that is serious about investing, now is a wonderful time to get started with a MAPsignals PRO subscription.

Good things are coming!
post mediapost mediapost mediapost media
MAPsignals
Solutions - MAPsignals
MAPsignals’ volume and price analysis tools enable investors to identify unusually large trading activities around individual stocks and ETFs. This allows traders and investors to move beyond sentiment with a more precise, predictive, and measured data analysis tool that MAPs the signals being delivered by the market’s biggest players.MAPsignals capabilities include: Read more »

MACRO: Don’t Overreact to Geopolitical Headlines
Recent Middle East tensions are a reminder that geopolitical risk can flare up suddenly. And the headlines can be scary. But emotional, knee-jerk reactions aren’t the answer. Don’t overreact to geopolitical headlines.

See, geopolitical events are always a surprise. They’re inherently unknowable, so they’re never priced into the market.

That’s why stocks initially sell off on nasty geopolitical news. And it’s easy to overreact in the heat of the moment.

Emotional overreactions are a mistake. MAPsignals has your back with our unemotional, data-driven, geopolitical playbook.

Today, we’ll show you how to play the latest Middle East tensions and why our Big Money Index (BMI) agrees. Then we’ll identify the four sectors seeing the most Big Money buying in this volatile tape.


We know it’s easy to get faked out by geopolitical curveballs. That’s why we created an unemotional, data-driven geopolitical playbook you can use anytime bullets fly.

We analyzed 29 geopolitical events since 1940, ranging from wars to terrorist attacks to coups to pandemics. Here’s the upshot: timeframes matter!

What stocks do immediately after a geopolitical event doesn’t always tell you where they’ll be once the dust settles.

The S&P 500 has averaged 1.4% and 1.1% drops, respectively, a week and a month after geopolitical events. After Iran bombed Israel on April 13, the following week the index was down 3.1%.

But check out how it doesn’t pay to overreact. On average, the S&P 500 gains 1.3% three months after geopolitical events. Even better, the index chalks up 5.8% and 12.1% gains after six and 12 months, respectively, both of which are way above average:

The data shows how stocks tend to bounce back quickly. Now let’s dig deeper.

The table below details how the S&P 500 has reacted to every major geopolitical event since 1940.

It’s a great cheat sheet you can reference anytime geopolitical volatility strikes.

History’s verdict is crystal clear: geopolitical uncertainty consistently drives short-term market volatility, but stocks almost always bounce back quickly.

When bullets fly, don’t run for the hills. Instead, start prepping your buy list!


Are we getting the same market message from the BMI?

It has been a fantastic timing tool. Subscribers know we’ve been nailing market pivot points with it for years.

The BMI tracks institutional money flows. Readings under 25% are rare, indicating stocks are oversold and it’s time to buy. Conversely, readings over 80% mean stocks are overbought and traders should lighten up.

Let’s check out how helpful the BMI’s been since this bull market began in the fall of 2022.

Then it nailed the peak last July as it went to an overbought 84% and indicated a pullback was ahead.

Then the BMI threw off a huge buy signal last October when it slid to a super-low 17%. It was rightly telling you to buy as stocks were bottoming out. The S&P 500 then rocketed 28% through the end of March.

Let’s face it, the BMI has an amazing batting average!

Here’s the latest: the BMI has swooned from 75% to 50%. A decline this steep, this fast is really rare. When the bottom falls out, it means buyers are on strike and sellers are taking over.

But don’t run for the hills. Instead, start prepping your buy list. Capitulation is likely around the corner.

Remember, we’re looking for contrarian buy signals from the BMI when it drops to 25%. That’ll be the green light that stocks are ready to bounce.
Trying times are buying times!


The key takeaway from both our geopolitical playbook and the BMI’s recent drop is to expect short-term volatility.

But don’t panic. This is likely a buying opportunity ahead of a big rebound.

If all you do is buy extreme weakness in the S&P 500 index, you’ll do well.

To do even better, focus on sectors seeing the most Big Money buying.


Market broadening is kicking into high gear as a strong economy and rising interest rates fuel a rotation out of technology and into cheaper, more cyclical sectors. Think energy, industrials, financials, and materials. It’s a safe bet these cyclicals will play a much bigger role in driving this bull market’s next leg higher. Check out our latest sector rankings to see how cyclicals have risen:


We know it’s easy to get faked out by geopolitical curveballs. That’s why we created an unemotional, data-driven geopolitical playbook you can use anytime bullets fly.

Since 1940, the S&P 500 has averaged 1.4% and 1.1% drops, respectively, a week and a month after major geopolitical events.

But don’t overreact to geopolitical headlines. Stocks tend to bounce back quickly.

On average, the S&P 500 gains 1.3% three months after geopolitical events. Even better, the index chalks up 5.8% and 12.1% gains after six and 12 months, respectively,

History’s message is clear. Geopolitical volatility is a buying opportunity.

The BMI agrees. It has collapsed at a rate rarely seen in the last 10 years. Whenever we’ve observed similar action, the next couple of weeks were volatile, with stocks in the red.

Don’t fret. A monster rally usually follows three months later. Prepare to buy the dip…and ride the rip.

If you want to find specific energy, industrials, materials, and financials stocks ramping with Big Money support, get started with a MAPsignals PRO subscription. It’ll get you access to our portal that updates every morning, showcasing the exact tickers getting bought and their scores.

As we’ve highlighted previously, brand new stocks are leading the next leg higher.

Our prized Top 20 list is full of market-beating equities in these new sectors.

There are plenty of winning cyclical stocks to buy on weakness as the market broadens out. If you’re a Registered Investment Advisor (RIA) or a serious investor, use a MAP to find them!

Invest well,
-Alec Young
post mediapost mediapost mediapost media
MAPsignals
Solutions - MAPsignals
MAPsignals’ volume and price analysis tools enable investors to identify unusually large trading activities around individual stocks and ETFs. This allows traders and investors to move beyond sentiment with a more precise, predictive, and measured data analysis tool that MAPs the signals being delivered by the market’s biggest players.MAPsignals capabilities include: Read more »

Entering the Season of Volatility
The buyers’ strike continues.
After Friday’s equity dump, popular positions have been under pressure.
We believe the slide isn’t over. Money flows and history suggests we’re entering the season of volatility.

Last week was a reminder of how fast stocks can reprice. The S&P 500 dropped 3.04% and the tech-heavy NASDAQ 100 fell 5.36%.
While this healthy pullback came as a surprise to many folks, our data was again well-ahead of this move. When the bottom falls out of the Big Money Index, it’s alerting that there’s a lack of demand for equities.
After spending years on institutional trading desks, I learned to respect what the Big Money players are doing with their capital. Supply and demand is the ultimate power law for stocks.
When the bids fade, stocks flop…it’s that simple.
The good news is these pullbacks, while unexciting to sit through, eventually offer great deals on high-quality businesses once the buyers’ strike ends.
The less good news, depending on your perspective, is there’s a decent chance the current drawdown isn’t over.
As we’ll dive into, both our data and history indicate we’ll have to ride through more bumps before the market pumps.
Our data has been down-trending for months. Our North Star, the Big Money Index (BMI), has been falling from extreme overbought conditions since February.
A falling BMI indicates that institutional sponsorship (inflows) is drying up. As you can see, while the rate of decline for the BMI has moderated, it’s still breaking new lows:

Until the tides shift, I still have to keep a cautious stance.
When you dive below the surface, outflows have been seen in one of the hottest areas of the market: Technology.
Ultra-crowded positioning has come under attack.
If you recall, over a month ago, the Technology group in particular suddenly began to drop in rank. This is important for the health of major indices because the sector represents nearly 30% of the S&P 500 $SPY …by far the largest allocation.
Those areas are still thriving as seen in our sector ranks. This has come at the expense of Technology $XLK falling into 7th place:

And this data very much jives with the money flows we’re witnessing. When you study single stock buys and sells since March 15th, Technology has suffered 2:1 outflows.
We see this money rotating into select Energy, Financials, Industrials, and Materials as shown below from our portal:

Data really is beautiful! These powerful clues reveal why following money flows often alerts investors to potential volatility ahead.
I firmly believe we aren’t out of the woods yet for markets. I can see us retesting Friday’s lows…and even experiencing a small bout of capitulation.
There are 2 reasons for this idea. First, inflows into smaller cyclical areas are no match for outflows in mega-cap technology stalwarts.
When the latter comes under pressure, expect indices to remain anchored.
Secondly, history suggests we’re entering the season of volatility.
It’s one thing to have cold hard data guide your trading. It’s another to have those same insights dovetail with hard-hitting historical evidence.
As we showed last week, a free-falling BMI tends to spell trouble for stocks over the near-term. That message didn’t disappoint with Friday experiencing one of the largest pullbacks we’ve witnessed in 2024.
Turns out there’s another reason to expect more near-term bobbing and weaving. Going back to 1998, April 19th – May 19th sees large- and small-caps return lackluster performance.
In this seasonally weak period, the S&P 500 is flat while the S&P Small Cap 600 gains a modest .07%.
But don’t zip your bear suit too tight. Beginning May 20th, seasonal strength kicks into high gear through July with the S&P 500 ramping 1.74% and small-caps flying 2.52%.
The remainder of the year also sees further average gains:

Based on the last 26 years, we’re entering the season of volatility. And this echoes the same message found in our money flow data.
It’s not surprising that the Big Money has already jumped ahead and started selling stocks in front of this historically weak period.
But the important message, that we drive home year after year, is you want to be preparing an all-star buy list.
These selloff events offer outstanding deals on incredible companies at value prices. That’s the playbook we’re gearing up for with our subscribers.
It’s simple.
Near-term, embrace the dip.
Then ride the rip!
A beautiful buy the dip situation is unfolding.
Let’s wrap up.
Here’s the bottom line: Markets are not out of the woods yet. Money is rotating out of big tech and into cyclical areas like Energy, Financials, and Industrials.
But those inflows are no match for outflows in mega-cap giants.
For that reason, expect an anchor on major indices until the selling slows.
Add to it that history proves how stocks tend to show lackluster performance from April 19th – May 19th.
This tells us to ride out the dip…but also prepare for a coming rip!
Let data light the path.
Follow the Big Money!
If you’re a serious investor or Registered Investment Advisor (RIA) looking for state-of-the-art research to add to your arsenal, get started with a MAP PRO subscription.
Opportunities like this rarely come along.
Let a market map lead the way!
post mediapost mediapost mediapost media
MAPsignals
Solutions - MAPsignals
MAPsignals’ volume and price analysis tools enable investors to identify unusually large trading activities around individual stocks and ETFs. This allows traders and investors to move beyond sentiment with a more precise, predictive, and measured data analysis tool that MAPs the signals being delivered by the market’s biggest players.MAPsignals capabilities include: Read more »

WHEN THE BOTTOM FALLS OUT OF THE BIG MONEY INDEX | S&P 500 Analysis
In this video, we show why a free-falling Big Money Index (BMI) spells trouble for stocks over the near-term. The S&P 500 struggles in the coming weeks. But don't get too bearish because this will prove to be a great dip to buy.

post media
YouTube
WHEN THE BOTTOM FALLS OUT OF THE BIG MONEY INDEX, LOOK OUT BELOW | S&P 500 Analysis
#Pullback #Stocks #LucasDowney When the bottom falls out of the Big Money Index, a huge opportunity is around the corner: https://mapsignals.com/map-blog/whe...

How the S&P 500 Typically Reacts to Geopolitical Crises | BNN Bloomberg
Alec Young, our chief investment strategist, joins BNN Bloomberg to talk about why investors shouldn’t overreact to spooky geopolitical headlines.

YouTube
How the S&P 500 typically reacts to geopolitical crises
Alec Young, chief investment strategist at MapSignals, joins BNN Bloomberg to talk about why investors shouldn't overreact to spooky geopolitical headlines.S...

When the Bottom Falls Out
Fear is swirling.
Equities are under pressure.
When the bottom falls out of the Big Money Index, a huge opportunity is around the corner.

Wow. What a difference a week makes. We’re finally witnessing a pullback that most thought was impossible. The overarching bullish sentiment seemed to never stop.

That is, until recently. A cocktail of investor worries are weighing on stocks:

  • Interest rates are surging. The 10Y yield broke above 4.60%, a level last seen in November
  • Geopolitical uncertainty is increasing with Middle East attacks
  • And the threat of rates remaining higher for longer has traders betting that interest rate cuts will get delayed, possibly into 2025

While I could opine on each of these macro worries, today we’ll focus on MAPsignals bread and butter: Money flows.

Right now, there’s a dramatic shift in our data. In fact, we’re observing a rare BMI dump that’s only occurred a few times in recent history.

When investors stop buying stocks, there’s nowhere for prices to go but lower.

Today, we’re going to size up the new data landscape, then we’ll look to history for clues on what’s ahead.

Expect a dip before a monster rip.


It’s always good to rewind the tape. Nearly 6 weeks ago, I noted how our trusty market gauge, the Big Money Index (BMI) was declining.

Preparing our readers for a stock market dump before the pump, was not a popular topic at all at the end of February.

But as we’ve learned time and time again, supply and demand ultimately determines market direction.

When money is flowing into stocks, they rise. When money comes out, they drop.

A falling BMI is our canary in the coal mine, alerting us that all is not well under the surface of the market.

While the BMI can be early and delayed, it won’t be denied. This past week saw one of the largest drops in the BMI ever:

Over the past 4 trading days, the BMI fell from 69% to 57.1% this morning. That’s a monumental collapse of 11.9%.

When the bottom falls out of the Big Money Index, it can only mean that buyers have gone on strike and sellers are taking over.

Below reveals this beautifully. The last few days reveal the least amount of buying in 2024. Also to note is we’re witnessing the most selling since October:

While the selloff is well underway and a lot of destruction has already taken place, it’s important to note where the outflows are occurring.

Interest rate sensitive groups like Real Estate, Biotech, and Clean Energy are the pain points. As global rates surge, these capital-intensive groups have suffered.

Does that mean the coast is clear? NO

As I mentioned to our members on Monday, we have yet to see leadership quality stocks get sold. In other words, this selloff is lacking one element to give us a strong “buy the dip” signal: Capitulation.

Capitulation is broad-based selling that hits all areas…even the great stocks. Those golden hour moments typically create an excellent time to shop for value opportunities.

Based on history, we are likely to see a bit more downside before a monster rally.

Check this out. Going back to 2014, I isolated all similar free-falling BMI periods that did not see capitulation. I found 15 discrete instances.

In the following 2-weeks, negative average returns were seen in both large and small-cap stocks.

Notably, the S&P 500 and S&P Small Cap 600 each fell 1.3% and 1.7% respectively the following week, indicating capitulation should come soon.

That’s the bad news.

The great news is these quick dips often offer a window of opportunity for the prepared. Three months later the S&P 500 jumps 3.3% and even better small-caps climb 4.1%:

This is why having reliable data is paramount in these trying times.

When the bottom falls out of the Big Money Index, don’t run for the hills. Instead, start prepping your buy list.

Capitulation is likely around the corner. That’ll be the green light that stocks are ready to bounce.
Trying times are buying times.

Let’s wrap up.

Here’s the bottom line: Markets are in a downtrend. Our Big Money Index has collapsed at a rate rarely seen in the last 10 years.

Whenever we’ve observed similar action, the next 2-weeks are volatile with both large and small-caps in red.

But don’t fret. A monster rally follows 2-months later.

We’re preparing to buy the dip… and ride the rip.

That’s the message we’re telling our members…a recipe that has worked countless times in the past.

We’re waiting for the capitulation signal to fire. Then we’ll go shopping for outlier stocks on sale.
That’s how you win.

Right now is a great time to join MAPsignals if you haven’t already. If you’re a serious investor, money manager or Registered Investment Advisor (RIA), get started with a MAP PRO subscription.

These windows of opportunity rarely come along.

You just need a MAP to guide you.
post mediapost mediapost mediapost media
MAPsignals
Solutions - MAPsignals
MAPsignals’ volume and price analysis tools enable investors to identify unusually large trading activities around individual stocks and ETFs. This allows traders and investors to move beyond sentiment with a more precise, predictive, and measured data analysis tool that MAPs the signals being delivered by the market’s biggest players.MAPsignals capabilities include: Read more »

Watchlist
Something went wrong while loading your statistics.
Please try again later.
Already have an account?